Solar Rebates Brisbane
There are currently generous solar rebates available for solar panels in Brisbane. Australia is split in four zones for solar rebates with each zone being entitled to slightly different rebates, depending on the geographical location. Essentially, the more sunlight an area receives, the higher the solar rebate. This is because the more sunlight you receive, the more clean energy you are likely to produce. These rebates come in the form of Small-scale Technology Certificates (STCs) and are associated with the size of the solar array, as well as the location it is installed in.
Brisbane is located in zone one, which means it receives the second highest amount of solar rebate in Australia. So, if you were to install solar panels in Brisbane you would receive between 45 STCs (3kW solar) – 1520 STCs (100kW solar). Each of these STCs has a monetary value, which at the time of writing is $35 per certificate. As an example, if you installed a 7kW solar array in Cairns, you would receive a solar rebate equalling 106 STCs x $35 = $3710.00.
Once you go over 100kW of solar panels you would no longer get any STCs, so there would be no upfront solar rebate. This solar system would then only be eligible for Large-scale Technology Certificates (LGCs). LGCs are paid as an ongoing subsidy are are dependent on the actual production of the solar panels, which is measured and reported using approved metering software.
Solar production in Brisbane
Brisbane has a humid subtropical climate, with generally warm to hot and humid Summers and milder dryer Winters. Brisbane’s overall temperature variability is somewhat less than most Australian capitals. Temperatures only occasionally reach 35 °C or more. June and July are the coldest months, with average maximums of about 22 °C; maximum temperatures below 20 °C are rare. Brisbane has never recorded a sub-zero minimum temperature (with one exception at night), and minimums are generally warm to mild year-round, averaging about 21 °C in summer and 11 °C in coldest month. From November to March, thunderstorms are common over Brisbane. However, on an annual basis, Brisbane averages 124 clear days.
Brisbanites basically don’t have too much to complain about with the weather! And as a result of all those sunny days your solar in Brisbane will do very well indeed. The general calculation for how much energy you can produce with solar power in Brisbane is 4.2 peak sunshine hours x the number of kWs you have installed. For example, a 1kW solar system should produce 4.2kW per day, on average, across the whole year. So, if you installed a 6.6kW system for you home, you would produce 27.72kWhs of electricity each day, when averaged out across the year (4.2 x 6.6 = 27.72).
Key points for solar panels in Brisbane
- Zone 1 for solar rebates
- Second highest in Australia
- Excellent solar production
- 4.2 “peak” hours of solar per day
- Local Brisbane installer
- Since 2011

More information:
Solar Power Panels Brisbane Case Study
How well do solar panels really work in Brisbane?
This easy to read article get right to the point and avoids any BS or sales jargon. If you are thinking about whether solar panels in Brisbane are worthwhile for your home or business, then read on! Forget the data sheets and sales pitch, let’s take a look at how solar panels really work in Brisbane.
So, based on a real installation in the Brisbane suburb of Runcorn, we look at what the expected solar production was vs. the actual output over a full year.
If you would like to check out how much money you can save on your own solar for your home or business, try our free solar calculator.
It is all very well and good looking at datasheets and estimated solar production figures, but what actually happens after the system has been installed? Does it live up to these estimates?
GI Energy have been installing solar panels in Brisbane since 2011, and this particular his system has 7kW of Q Cell Solar panels and a Fronius Symo 6kW inverter.
Here are some things to note before continuing to read: We have taken a real solar install in Brisbane and used actual data from the online monitoring set up at the home. This data is simply measuring current running through cables and is 100% accurate.
We have then compared this real-life data to a simulation for solar panels in Brisbane using software called Nearmaps. This software creates a chart showing how much energy is expected to be produced. We can then compare the solar simulation with the real results.
In a nutshell:
Solar Panels Brisbane expected energy VS Solar Panels Brisbane real-life energy.
Firstly then, let’s take a look at the actual installation specifics. Don’t forget, this is an actual solar installation in Brisbane we completed in March 2018.
We have one array:
- 25 x Q Cell QPlus 280w panels at 22.5° tilt and 9° orientation relative to North.
When we program this into the Nearmap solar simulation toll this is what the expected solar production should be:
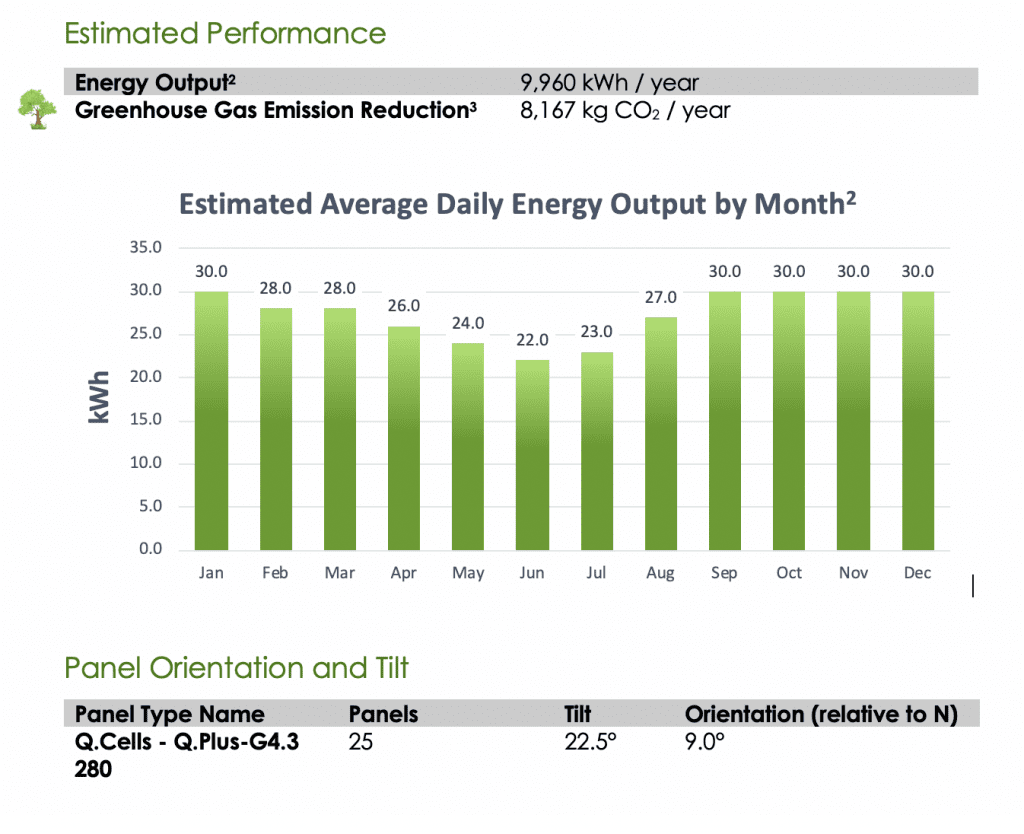
The total expected solar production for the solar panel simulation for Brisbane was 9,960kWhs.
Now we can take a look at how the full year in 2019 actually performed by looking at the online monitoring:
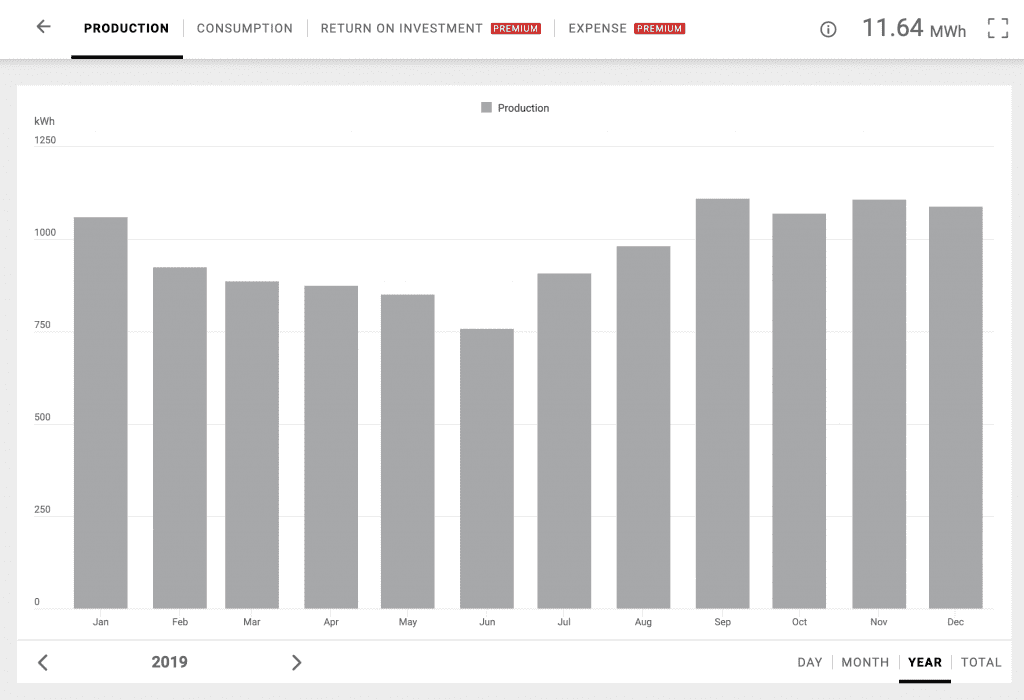
The total amount of energy produced in 2019 was 11.64MW, which is 11,640 kWhs.
Results:
Solar Panels Brisbane Expected: 9,960kWhs
Solar Panels Brisbane Actual: 11,640kWhs
Difference: 1,680kWhs
So, the actual system installed in Brisbane produced 1,680kWhs more solar energy than expected…Yipeeee! But wait, what does this actually mean to someone looking at installing solar in Brisbane?
It means that the real-life figures are really good for installing solar panels in Brisbane. Bearing in mind, this is a solar array installed by a great install team, using really good products. If you did this test with inferior solar panels or a poor-quality installation it would most likely not produce anywhere near as much energy.
What does the difference actually mean in $$?
This system was expected to produce 9,960kWhs. If the customer here used 50% of the energy and exported the rest to their energy retailer then the solar array was expected to save the customer $2,091.60.
The system we tested produced 1,680Kwhs more than expected. The value of this will depend if you used the energy, or sold it back to the energy retailer. If you used the energy it would be worth approximately $420.00*. If you sold it back to your retailer it would only be worth $285.60**. The difference would depend on how much energy you used in the home during the day when the solar energy was peaking.
They could have used that extra $420 to buy something they actually wanted, instead of giving it to their energy company. I don’t know about you, but if I got an extra $420 every year that I didn’t expect from my solar system, I would be pretty happy!
This article is written in clear and basic terms for consumers to understand. For those who are keen to dig deeper into the specifics and look at the more technical side of testing solar panels in Brisbane, we can help with that too! Get in touch and our experienced CEC Accredited Solar Designers, electrical and electronic engineers and we will gladly spend as long as you like discussing and sending through pages and pages of data if you are interested. As mentioned, this article is designed to get right to the point and give every day consumers the information they need when trying to work out exactly how solar panels actually work in Brisbane.
*based on $0.25 peak rate plus gst
**based on $0.17 feed in tariff plus gst