How do Phono Solar panels really work compared to a well-known global top 5 solar manufacturer?
One of our favourite solar panel manufacturers is Phono Solar. There are lots of reasons why we love them: see our review or video overview here. As explained in our overview there are some downsides though (no one is perfect, right?). One major one being the lack of testing in Australia.
So, we took matters into our own hands.
We look at two solar systems installed in the same Brisbane suburb, with almost identical installs, and compare real results to see if Phono solar panels really do perform as well as we thought. We wanted to see how Phono Solar, which is a fairly unknown solar panel brand in Australia, compared to a global top 5 manufacturer.
The results really surprised us!
So, just to preface what you are about to read: At GI Energy we know how well Phono Solar panels work, because we install heaps of them, and we are always pleasantly surprised by the results. But what I hadn’t checked for a few years was…exactly how well compared to what’s expected when you are competing with a global brand name panel? It is all very well and good looking at datasheets and making calls about how good things are. But real-life conditions are very different to those in a lab and by the time solar panels make it to our homes, we don’t really know if they match up to the tech data.
For this experiment I am looking at a recent Phono Solar TwinPlus installation, and an unnamed competitor. I am purposely not naming of the other panel in this report because I don’t want unnecessarily belittle other panel manufacturers. What I will say is they are from one of the top 5 manufacturers in the world for volume, and they are considered to be one of the market leaders.
So how will Phono Solar stand up to this test against a global top 5 manufacturer? Here are the parameters:
- System A: 7.26kW Phono Solar Twin Plus with Fronius Primo 6 inverter
- System B: 7.8kW Competitor panel with Fronius Primo 6 inverter
- Both installed in the same Brisbane suburb
- Similar orientation (production estimates adjusted to suit to make results fair – explanation below)
- Same angle
- No shade on either system
- Both installed in the last 6 months
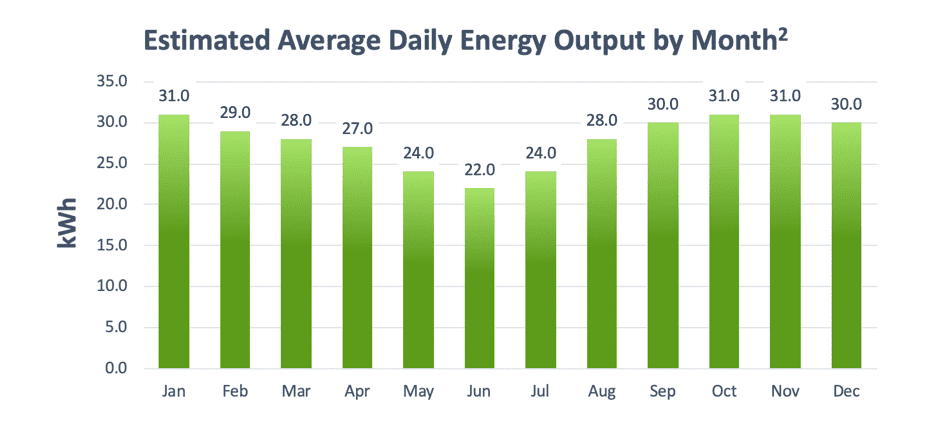
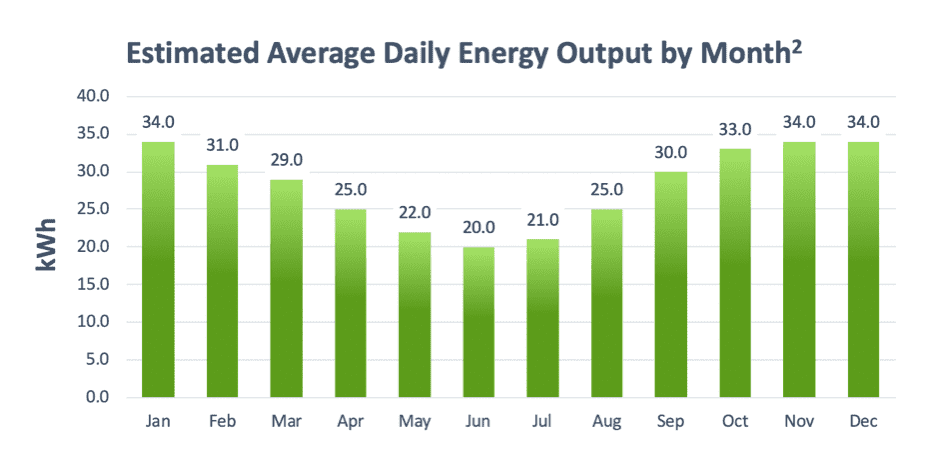
Important note: To make sure this is as fair as possible; we have made the slight adjustments necessary to cater for the installation variables. The key factor here was the Phono Solar panels were installed 9 degrees off North. The unnamed solar panels were installed 50 / 50 with half being 9 degrees off north, and the other half being directly East. In addition, the unnamed system also had more panels (7.8kW vs. 7.26kW). This is as close to identical we could find where monitoring data was available to us! With this in mind, we used the Nearmap solar tool to create simulations of how two systems should perform, given the installation variable. Here is what was expected:
Phono Solar system facing 9 degrees East:
Unnamed system with 50% panels facing due East, and 50% 9 degrees East:
The most recent full month of solar production prior to testing was May 2020. So, let’s take a look at the actual figures for each system:
First, let’s take a look at the Phono Solar system:
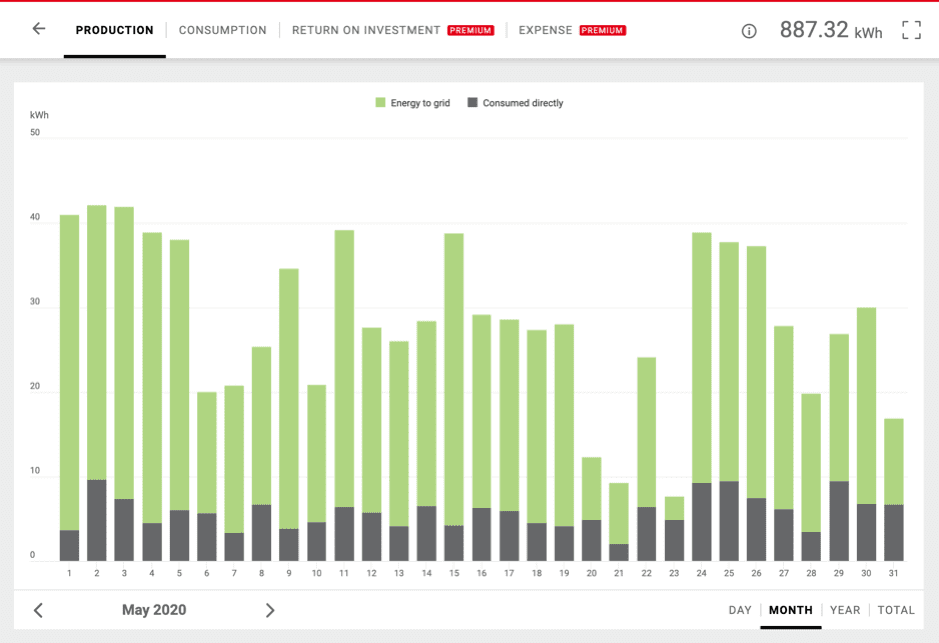
The chart above shows system yield of 887.32kWs for May, which is 28.62kWhs on average per day.
Now, let’s take a look at the unnamed competitors’ data:
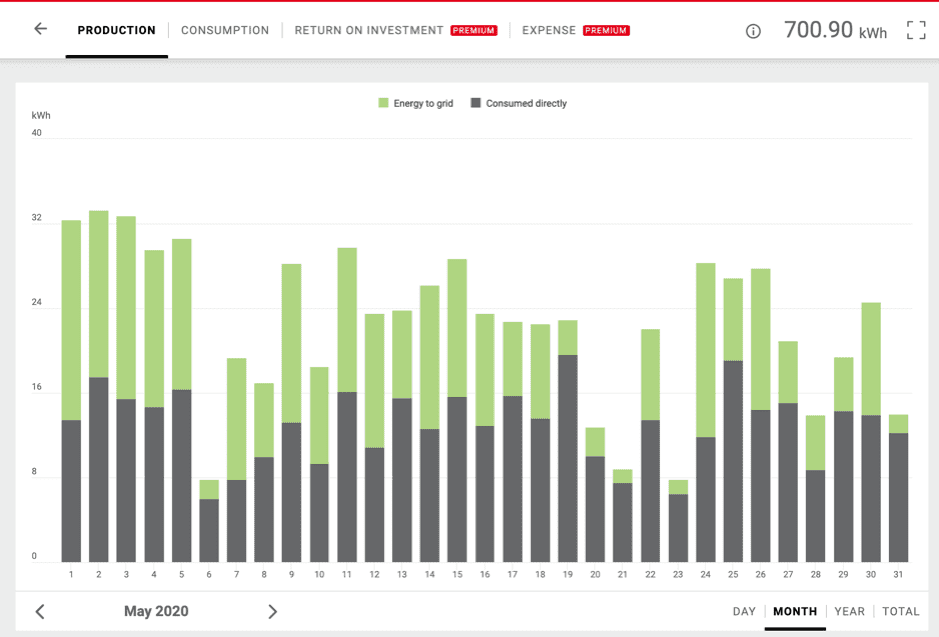
The chart above shows system yield of 700.90kWs for May, which is 22.6kWhs on average per day.
What does this tell us?
Firstly, the Phono Solar panels produced 28% more energy than the unnamed competitor. This alone is very impressive, but what about the install variables? After all, the Phono solar panels were installed in a favourable orientation, albeit with a smaller overall array. Well, this is where we need to look at the Neapmap data to see how both systems performed vs. how they were expected to perform, given the exact orientation of panels.
So, let’s take a look at the Phono solar panels data side by side:
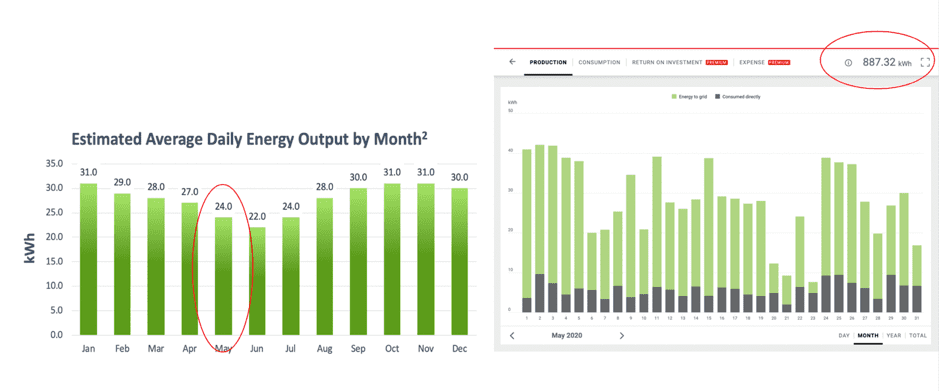
The expected amount of energy for May was 24kWhs per day. The actual data shows 28.62kWhs per day. So, this shows a 20% increase in production when compared to the expected production.
Now, let’s take a look at the unnamed competitor data side by side:
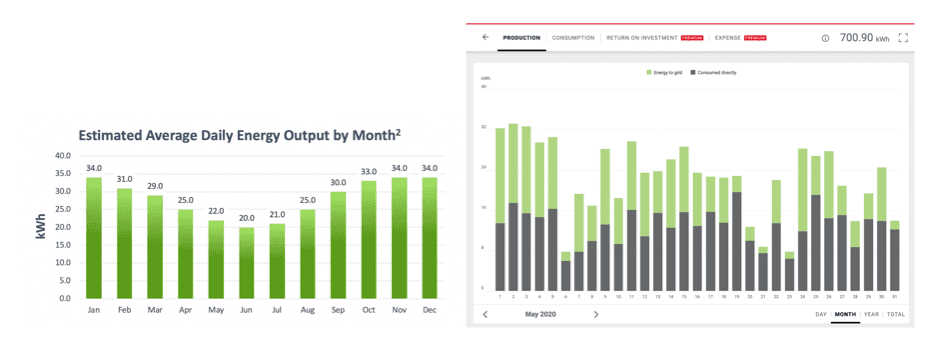
The expected amount of energy for May was 20kWs per day and the real-life data shows actual production of 22.6kWhs. This is 11% over the expected amount!
Summary:
- The Phono Solar panels produced 20% more than expected, while the unnamed global top 5 manufacturer competitor only produced 11% more.
- If the Phono solar panels continue to produce 20% more than expected for the whole year, this will result in an additional 2,037kWhs of solar yield in one year.
- This would represent an additional saving of between $346.29 and $509.25 in one year. The lower amount being calculated on the $0.17 feed in tariff this customer gets from AGL, and the higher amount being calculated based on the peak rate charge of $0.25 on the same AGL account.
A 20% increase in expectations for a solar array is obviously an outstanding result. Phono Solar fly under the radar somewhat in Australia, mostly due to lack of consumer branding and marketing. But results like this show why our very own Managing Director has recently installed a 15kW Phono Solar system on the roof on his own home!
Other noteworthy points:
The unnamed competitor in this experiment still performed 11% better than it was expected to. Please keep in mind though this solar panel was from a top 5 global manufacturer, not a cheap and nasty product!
Check out of Phono Solar panels page for more information about the product and up-to-date data-sheets.
Other useful links:


