Do you want to fairly calculate the benefits of solar on a rental property? We’ve spent months developing software to do just that. The examples in this article will be a fantastic start to negotiating an outcome that both landlord and tenant will be happy with. You’ll be excited to see the savings a solar system can provide and what your share will be.
Before you start, it’s helpful to understand that GI Energy provides savings estimates and quotes that are realistic and achievable. We are accountable for the figures we provide under the Clean Energy Councils Code of Conduct, which is underpinned by the ACCC.
In addition to the code of conduct, we invest heavily in developing systems and policies that will produce the best outcomes for consumers, not only at the time of purchase but throughout the life of your solar system.
Trust and a fair outcome for everyone involved will be the basis of success in this trial, and to that end GI Energy is committed to ensuring everyone involved has a clear understanding of what is possible and has an outcome that meets expectations.
Calculating the benefits
We have spent some time thinking about how we help the landlord, tenant and agent navigate this process. We decided against a simple calculator because it does not provide perspective of what is achievable. Instead, we have provided a series of tables that you can use to navigate a clear understanding of best and worse case scenarios. We believe by doing this, you’ll feel more comfortable with your involvement in the trial.
The majority of this article is made up of savings charts. We have provided a ‘key’ to the charts below. Take your time to understand the key and you’ll be able to view the charts with clarity and assurance of the possibilities and fairness of the numbers.
Please note that these figures are a basis for negotiation. Whilst GI Energy believes these to be a fair outcome for all parties, we do not dictate the negotiation process for either party. We do suggest that this may be a great place to start. A review of savings in future years will help all parties settle into a split that works better in each situation.
The chart key
This key only shows one size system so that you don’t get lost in the numbers. The actual charts have four different system sizes to help you compare the benefit of each system 3kW, 4kW, 5kW and 6.6kW. The other reason for providing four size options is because some roofs may be limited to the size of system that can be installed.

1. Quarterly bill
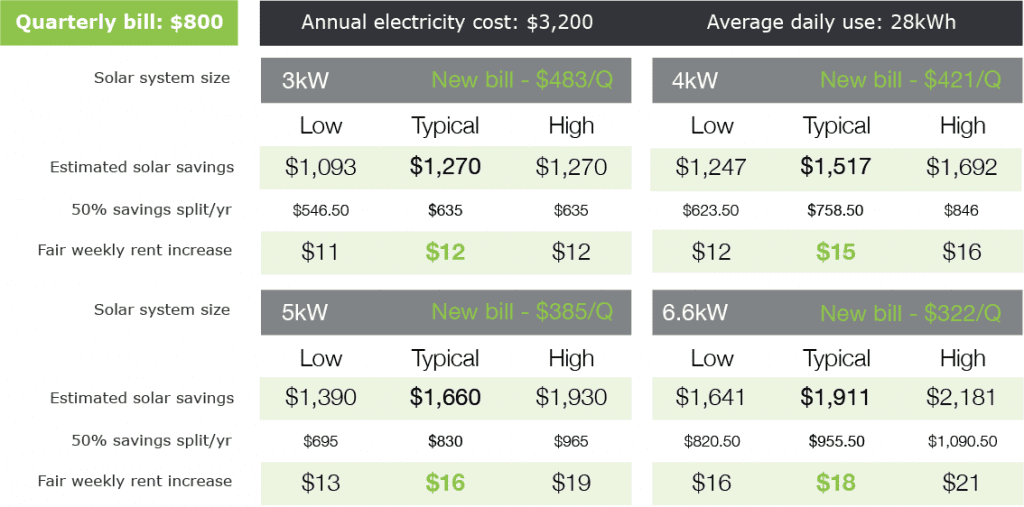
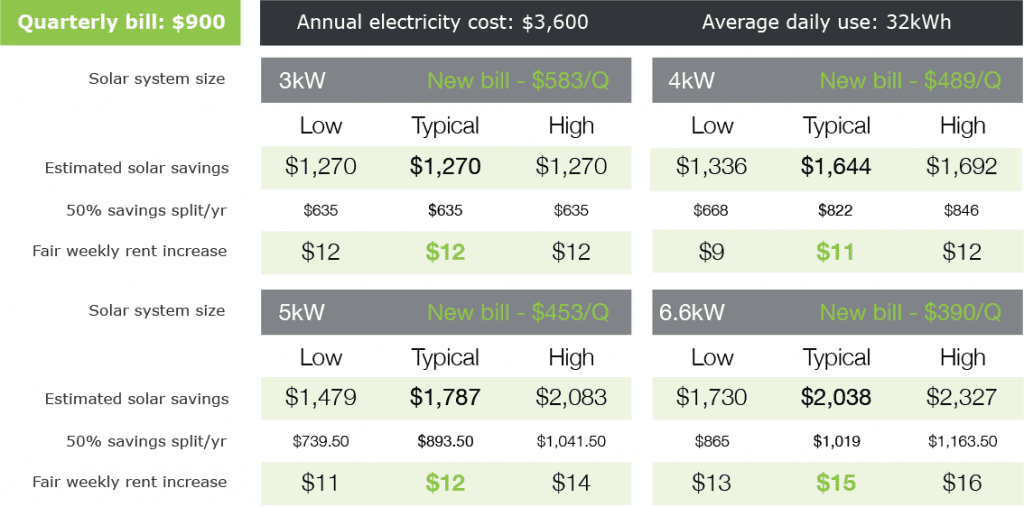
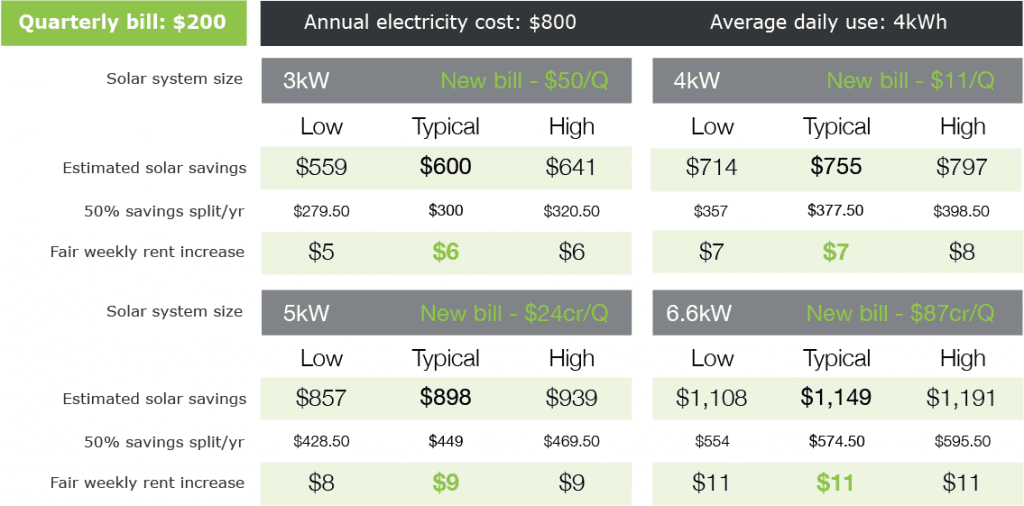
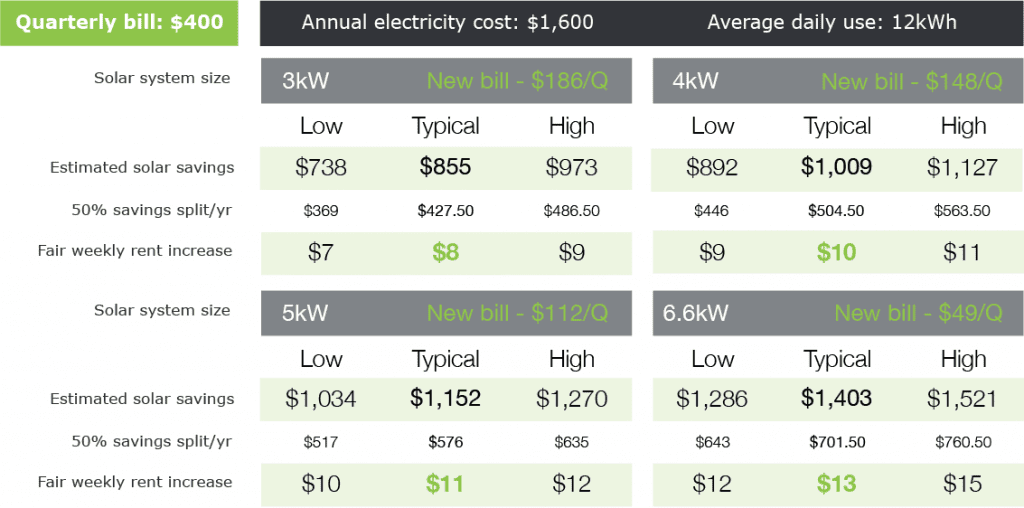
All charts are ordered by the quarterly bill amount. By working out the typical quarterly bill of the tenant, you’ll be able to browse the savings figures available for that bill amount. For landlords considering this, a $400 electricity bill is fairly typical and is a good place to start.
2. Solar system size
Four system sizes have been provided for comparison. If you are unsure of the size that will fit the rental property, select the size that suits you to begin the negotiation process. Once both the tenant and landlord have agreed to proceed, GI Energy will assist both parties by providing quoted options to aid the second stage of negotiation.
3. Estimated solar savings
These estimates are calculated to provide a reasonable starting point to negotiate a fair rental increase figure.
GI Energy has spend years developing complex financial modelling software to calculate estimates. In addition to this, GI Energy co-monitors hundreds of client solar systems remotely to ensure the best outcomes. Thanks to remote monitoring, we are also able to track actual solar savings over the years and refine our financial modelling software for greater accuracy.
It’s common for our clients to out-perform quoted savings estimates. In some cases bad weather, increased electricity costs or higher than pre-solar electricity use can lead to lower savings results. GI Energy is committed to the education of better energy management for our clients.
The estimates in these examples are based on a number of assumptions about electricity costs, feed in tariff rates and other electricity bill variations. Formal quoting is advised to obtain more accurate estimates.
4. Savings split
We have used 50% as the basis for all charts. It is up to the landlord and tenant to negotiate beyond this split. We believe a 50% split is highly beneficial to both parties and would suggest this is the best place to settle on a fair rental increase.
5. Fair weekly rent increase
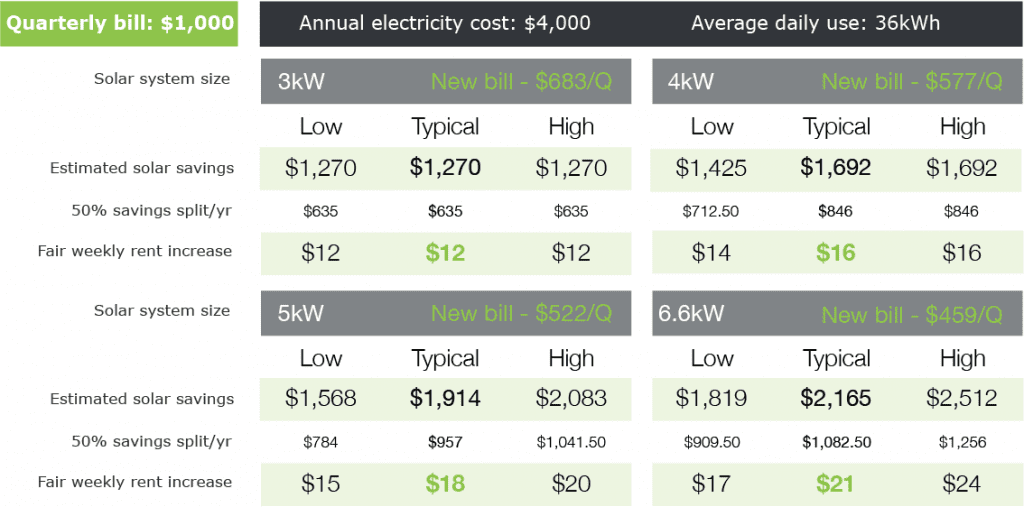
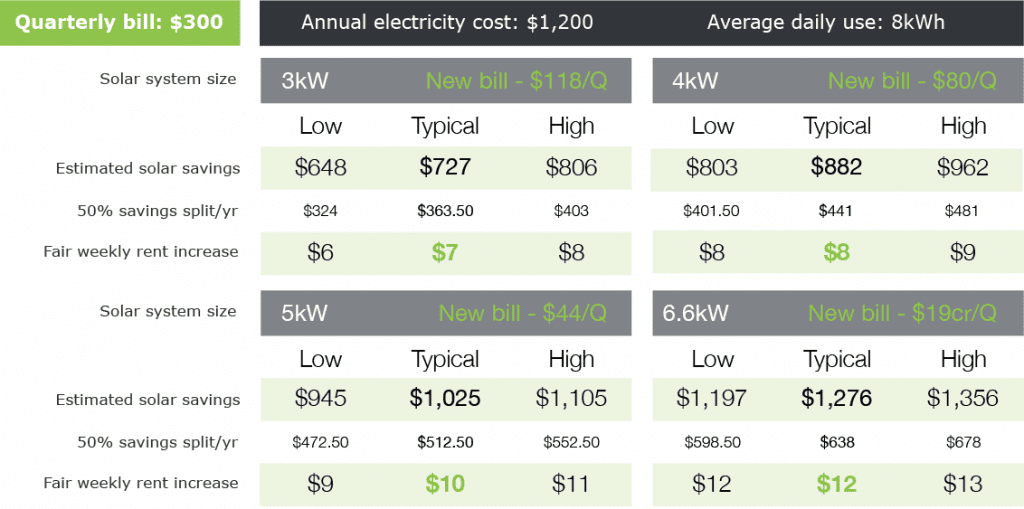
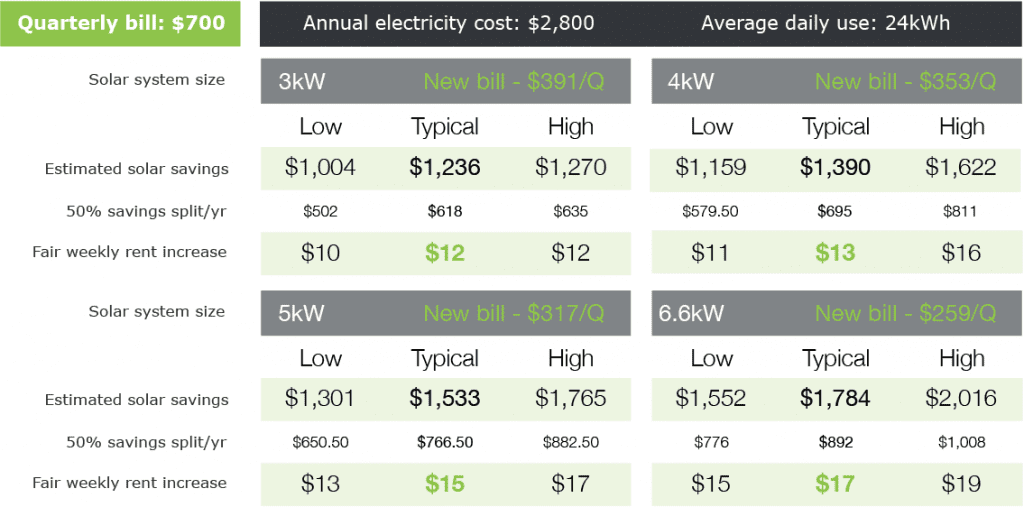
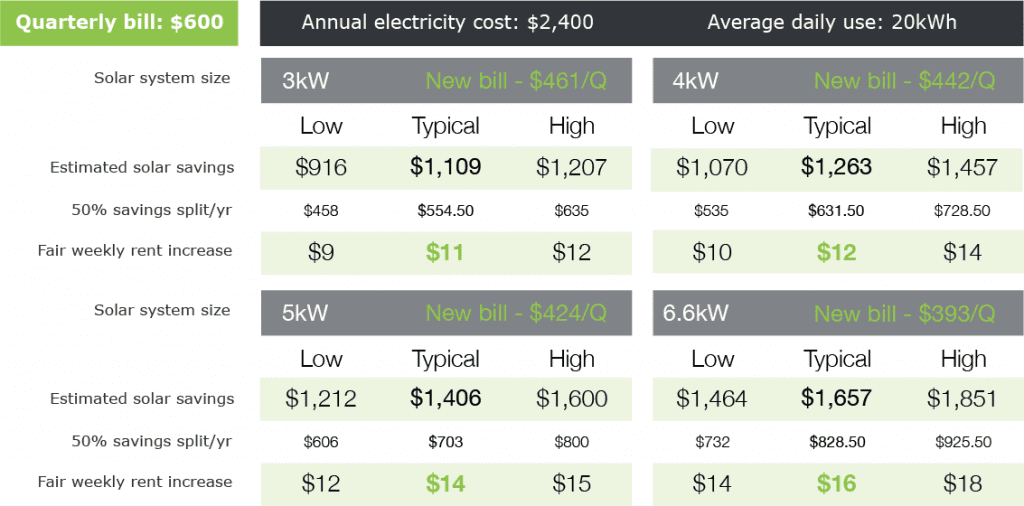
This has been calculated by taking 50% of the annual savings and dividing it by 52 weeks. We have also rounded it to the nearest dollar for simplicity of rental contracts. When considering a fair weekly rent increase, we recommend using the typical figure highlighted in green unless you are confident that your situation will only provide a low result.
6. Annual electricity cost
This is simply a quarterly bill multiplied by four to arrive at the annual electricity cost. The purpose for having this figure displayed is to compare it to the annual solar savings and the split savings amount.
7. New bill
This is the estimated bill after a solar system is installed. This is the cashflow benefit to the tenant and should be compared to the current typical bill.
8. Low, typical and high savings estimates
Three levels of savings estimates have been provided because consumers can achieve different results based on individual electricity consumption habits. These examples will help tenants work out how they consume energy for a more accurate savings result.
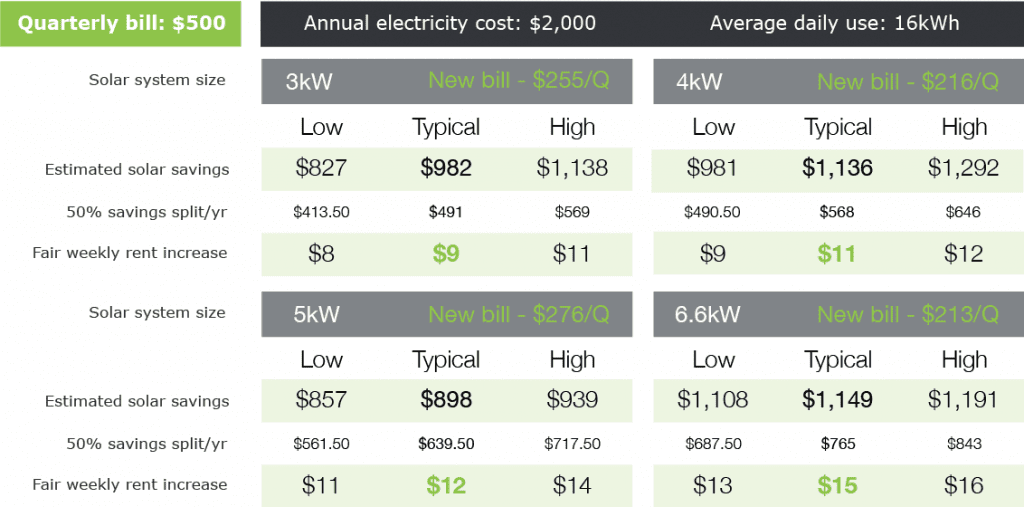
Figures are calculated as a percentage of the tenants current energy consumption. The descriptions below are based on 16kWh of average daily consumption (see example above).
- Low – 35% of daily energy consumption (5.6kWh) covered by free solar energy, leaving 10.4kWh purchased from the grid. These savings figures are often achieved by smaller households who work between 6am and 5pm during the week. They are not able to take full advantage of solar during the week, but do tend to use more during the weekend.
- Typical – 50% of daily energy consumption (8kWh) covered by free solar energy, leaving 8kWh purchased from the grid. For most homes where there are people at home during different times of the day, this is quite common to achieve. Most family homes don’t use a lot of energy while they sleep, and consume more during the day.
- High – 65% of daily energy consumption (10.4kWh) covered by free solar energy, leaving 5.6kWh purchased from the grid. This result is typically achieved by energy conscious people using a remote monitoring application for guidance.
9. Average daily use
This is an assumed amount of energy that the tenant is likely to be using on a daily basis. The tenants actual average daily use it typically displayed on the electricity bill and should be taken into account at the time of quoting a solution. This figure is the most important figure in working out potential savings from a solar system.
Savings charts
The charts below are provided as example estimates only. These figures are designed to initiate a discussion between tenant and landlord (via the agent), It’s not important to get an exact figure during step one of negotiations. Please go with the estimate that you feel most comfortable starting with. When an electricity bill is provided and a roof assessment is carried out, GI Energy will be able to provide figures to complete negotiations between the landlord and tenant.
Scroll down to find your electricity bill amount.
Getting negotiation step 1 underway
Once you have settled on a good starting point by using these charts, download either our tenants letter of interest or landlords letter of interest. When you have completed it, hand it to your rental agent to pass along. If the agent receives notice that your letter is accepted for further investigation, GI Energy will be in contact to provide a quote and savings estimate for final review by both the landlord and tenant.
Links
Download the tenants letter of interest (coming soon)
Download the landlords letter of interest (coming soon)
Send me to the main article explaining this trial
Landlords guide (coming soon)
Tenants guide
Agents information page (coming soon)
A $200 quarterly bill
A $300 quarterly bill
A $400 quarterly bill
A $500 quarterly bill
A $600 quarterly bill
A $700 quarterly bill
A $800 quarterly bill
A $900 quarterly bill
A $1,000 quarterly bill
